A few of the prior works have leveraged provenance
data to understand the visualization system itself and
to evaluate its usefulness. Here, it is important to distinguish between conducting
statistical analysis on coarse user study metrics (e.g., speed, accuracy,
and preference) and the non-trivial analysis of provenance
data for the primary purpose of evaluating a visualization design
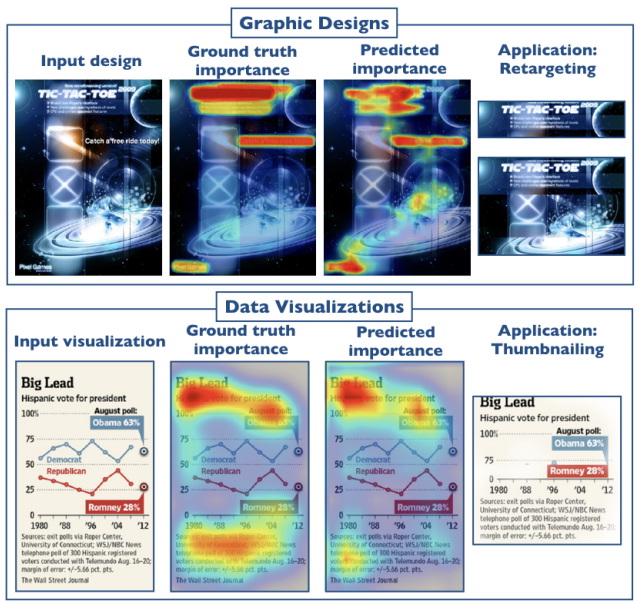
or system. For instance, Bylinskii et al. trained a neural
network on mouse click data to create an automated model that
learns the relative importance of visual elements for a given design.
Smuc et al. captured the provenance to identify when users have insights. Gomez and Laidlaw
modeled task performance
on crowd workers to evaluate system design and help guide encoding
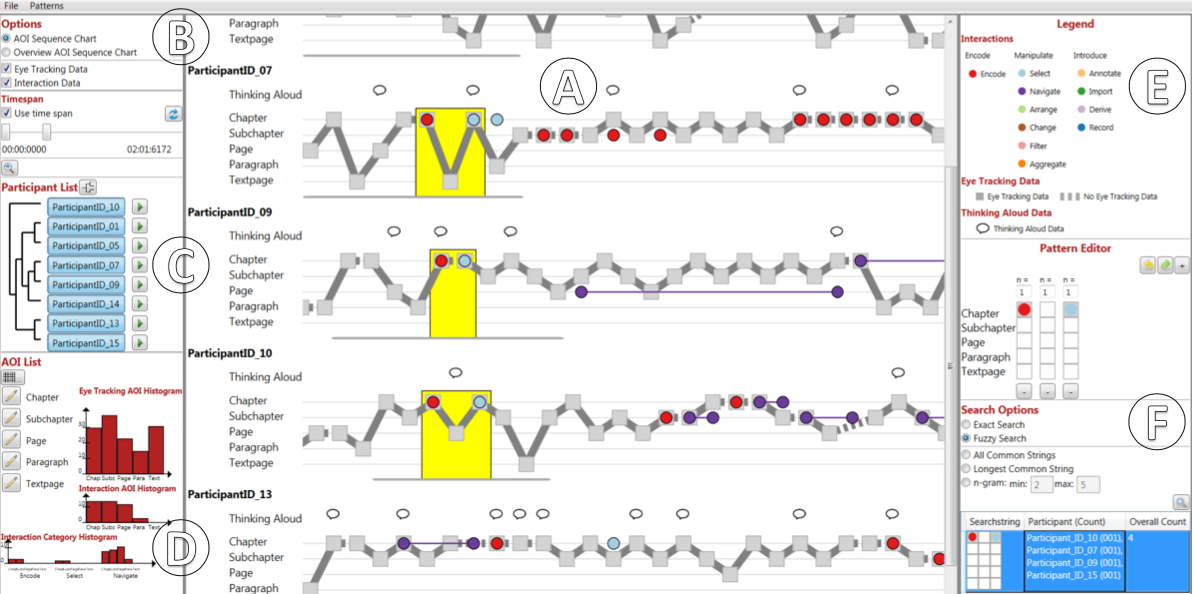
choices. Blascheck et al. created a visual
analytics system for evaluating an interactive visualization system.
Among other techniques, they used pattern matching methods to
uncover similarities within the provenance data of multiple users.