Since the purpose of using a visualization is to explore
data, discover patterns and relations, and eventually
build knowledge, many visualization systems encode
the user’s interactions as knowledge graphs, concept
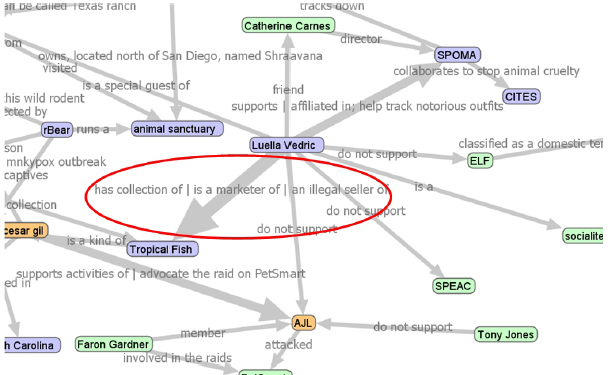
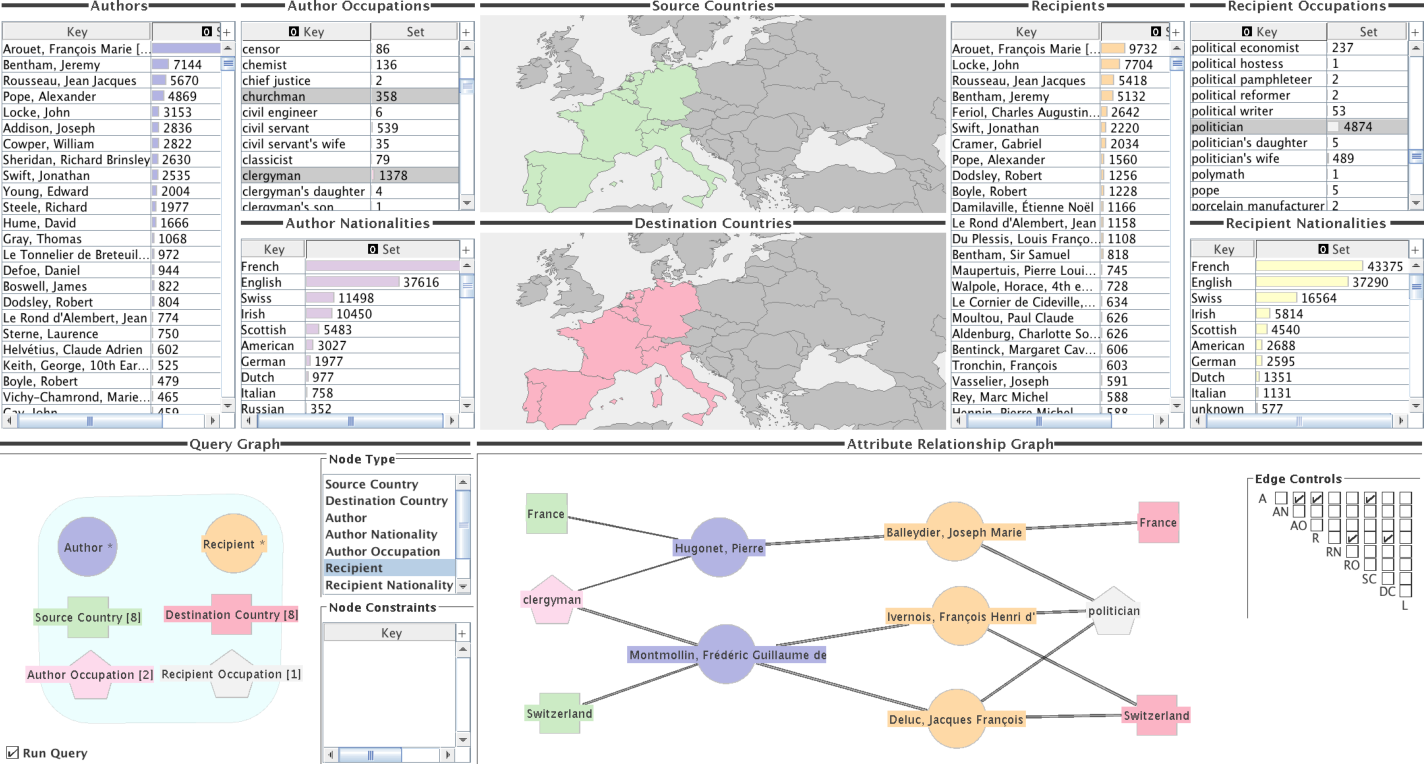
graphs, or history graphs. In most cases, the nodes in these
graphs represent a data item (e.g., a document, a location, an entity),
an abstract concept (e.g., user annotations), or a visualization
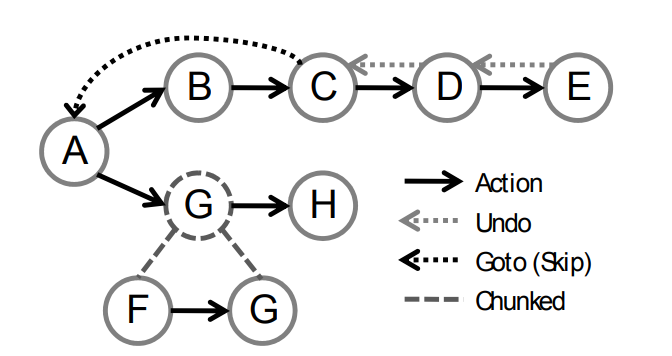
state (e.g., user histories). Edges then represent connections or relations
between these entities. In this section, we identify publications
that that use a Graph-based encoding approach and group
them into two categories: Entity and Concept Graphs and History
Graphs.